Bull Market Definition
A bull market occurs when the market is expected to continue higher over an extended period of time. Bull markets are primarily described when discussing stocks, but it can be related to bonds, commodities, futures, or forex markets. Bull markets occur when the demand for a security or group of securities outweighs the normal laws of supply and demand. This sort of demand pushes prices higher.
Why is it Called a Bull Market?
The term “bull” is used to describe the market, because bulls attack by pushing their horns out and up. Hence the thrusting motion up resembles the upward move of the markets. Also, when bulls run together, they do so without looking back and go full steam ahead. This is also the mentality of the markets as traders and speculators trip over themselves attempting to jump on the band wagon for quick gains.
Characteristics of a Bull Market
A bull market is accompanied with a number of identifiers. Below are some examples:
- High P/E ratios
- Endless news and media coverage of the market
- Marginal retracements after each successive high
Recent Bull Markets
There have been a number of recent bull markets. Most notably has been the rally in the Sensex, where it has run from 7,000 in June of 2005 to over 21,000 in early 2008. Another bull market occurred in the oil markets, where a barrel of oil ran from $60 to over $150 in roughly 18 months.

Bull Market
Bullish Indicators
How do we know if a stock is really bullish? To get an answer to this question, traders frequently use different trading indicators.
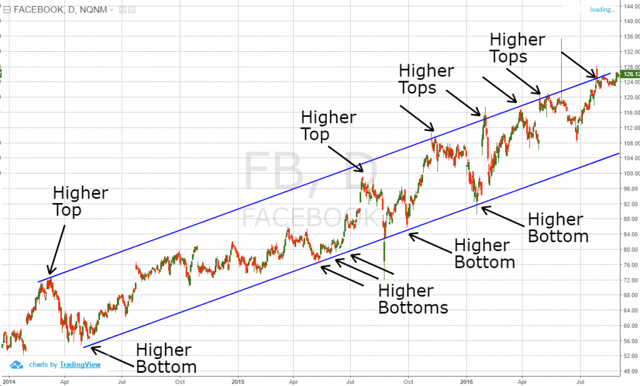
Bullish stocks tend to have higher bottoms and higher tops on the chart. This is the basic indicator that a stock is bullish. If you see a stock, which has higher highs and higher lows, there is a big chance that the next high will also be higher.

Bull Market
Above is the daily chart of Facebook for the years 2014, 2015, and 2016.
The blue lines on the image indicate the tops and the bottoms of the stock.
See that Facebook keeps creating higher tops and higher bottoms on the chart. This means that Facebook is in a strong uptrend.
Another indicator, which is among the most commonly used to measure bullish stocks, is a strong uptrend line.
The trend line consists of a single line, which goes through the bottoms of the rising bottoms.
A best practice for using the trend lines is to stay bullish as long as the price does not close below the trend line.

Bullish Uptrend Line
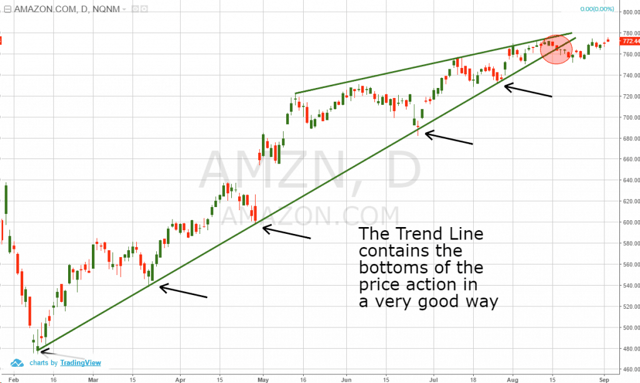
Above is the daily chart of Amazon. The chart covers the period from February 2016 through August 2016.
The image illustrates a bullish trend line which neatly contains the bottoms.
The stock also creates higher tops on the way up.
Suddenly, each high begins to lost its intensity on each run up.
This implies the bullish trend might be interrupted. AMZN then breaks the trend line (red circle), which is an indication that the increase might be interrupted.
Bull Market Trading Strategies
Again, a good way to confirm a bullish trend is to use the trend line indicator.
A bull run is confirmed after the price action touches a single line for the third time and bounces in a bullish direction. If you see this happening, you can buy the stock.
It is recommended that you place a stop loss order below the bottom created at the time of the bounce.
After all, you need to secure your trade against unexpected price moves.
Then, if a stock begins to increase, you need to hold the trade as long as the price is on the upper side of the trend. If you see a candle closing below the trend line, you need to close your trade on the assumption that the bull market run might be interrupted.
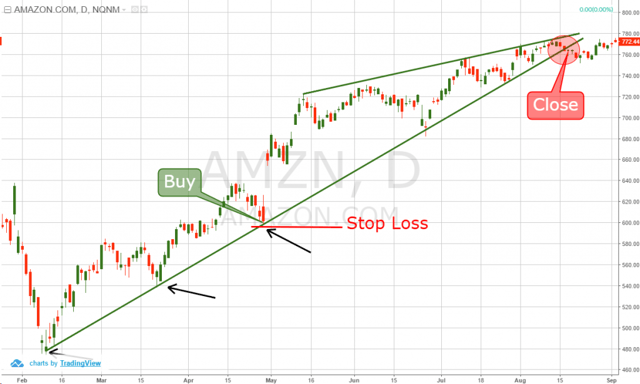
The next image will show you how to apply this bull market trading strategy:

Bull Market Trading Strategy
This is the same Amazon chart. We suggest that you buy AMZN the moment it bounces for third time from the green bullish trend line. The stop loss of the trade should be placed right below the third bottom on the trend line, as shown on the image.
There are four more interactions with the bullish trend line afterwards. The first three result into the creation of a new bullish impulse. The last interaction with the green bullish trend line leads to a breakout. It is shown in the red circle. You should close the trade the moment when the price action breaks the green bullish trend downwards.
Bearish Market
Now that you are familiar with the bullish market, we should approach the bearish side of the coin.
The bearish price move is again caused by the correlation between the supply and the demand for the respective asset. When the supply of a stock is higher than its relative demand, the stock tends to decrease in price.
A stock is bearish when it accounts for lower tops and lower bottoms. In this manner, the bearish trend lines act the same way as the bullish trend lines, but in an opposite direction.
Bull Market vs Bear Market
The ease of movement consists of a single line, which fluctuates above and below a zero level. A higher positive EOM value indicates that the price is increasing with relative ease. This means that the stock is likely to be trending upwards.
Opposite to that, a lower negative EOM value means that the stock is decreasing with relative ease. In this case, the security is probably trending downwards.
The ease of movement combines well with the trend line indicator. For this reason, I will now show you how to use both tools together to create a profitable trading strategy:

Bull Market vs Bear Market
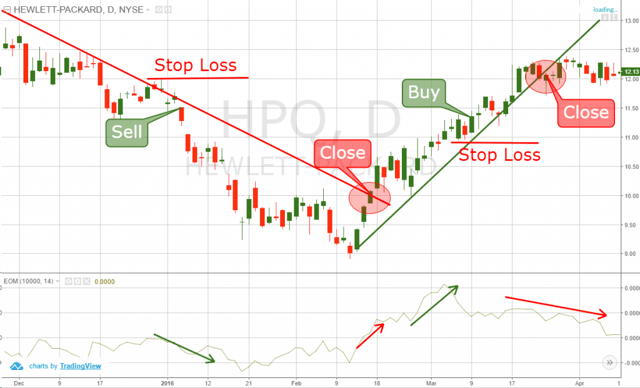
Above you see the daily chart of Hewlett-Packard from December 2015 to April 2016.
HP starts off with a price decrease. After the third interaction with the bearish trend line we get a bearish signal on the chart. At the same time, the EOM indicator bounces downwards from the zero level. This gives us a signal that the price is decreasing with relative ease. Therefore, we sell the stock and we place a stop loss order above the created top.
Later, the price action breaks the trend line. At the same time, the EOM indicator switches above the zero level. This means that the price is increasing with relative ease. Therefore, we close our trade on the assumption that the stock will pick up in value.
We then build a bullish trend line. The price action bounces three times from the trend initially.
On the third touch, the EOM line is already high above the zero level. This means that the stock is already increasing with relative ease. Therefore, we buy HPQ, placing a stop loss below the bottom.
When the stock breaks the bullish trend line downwards, the EOM line is already decreasing. This means that the stock decreases its ease of bullish move. For this reason, we close our trade and collect our profits.
Difference between Bearish and Bullish Stocks
Technically, there is no difference between bearish and bullish stocks. As you see, both bullish and bearish trends look the same.
Conclusion
- A stock is bullish when the demand is higher than the supply.
- The name “bullish” comes from the natural instinct of the bull to push its enemy upper with its horns.
- Some of the characteristics of a bullish market are:
- High P/E ratios
- Endless news and media coverage of the market
- Marginal retracements after each successive high
- A stock is bullish when the buying pressure is higher than the selling pressure.
- You can make money from the bull market by buying low and selling higher. The difference in the prices determines your profit.
- Two of the basic bullish market indicators are:
- The higher highs and higher lows
- The bullish trend line
- The basic bullish trend line trading strategy is:
- Buy when the stock bounces for third time from a single line.
- Place a stop loss below the bottom created in the moment of the bounce.
- Collect your profit the moment when the price action breaks the bullish trend line in bearish direction.
- The bearish market is opposite to the bullish market.
- A stock is bearish when it decreases in value.
- The bearish stocks have bigger selling pressure than buying pressure.
- Bearish stocks account for lower tops and lower highs.
- You can profit from the bullish and the bearish market by properly identifying each price swing. You can do this with the help of the trend line and the Ease of Movement Indicator and the trend line:
- Open trade when the price bounces off a trend for third time and the EOM gives the respective value.
- Put a stop loss beyond the top/bottom created in the time of the bounce.
- Close the trade when the price breaks the trend supported by a high/low EOM value.
- Most of the stocks are likely to increase in the long term.


 Basics of Stock Trading
