There are two longer-term moving average crossovers that are most famous or infamous among traders. Depending on the type of investor or trader, one is usually looked at as more favorable than the other. These would be the golden cross and the death cross. Both require the same moving averages, but in different contexts.
In this post, we'll explain to you exactly what a death cross in trading is, along with some examples. By the end of this tutorial, you'll know what happens after a death cross occurs, what a death cross in Bitcoin looks likes, and when the last death cross occurred.

What is the death cross in stocks?
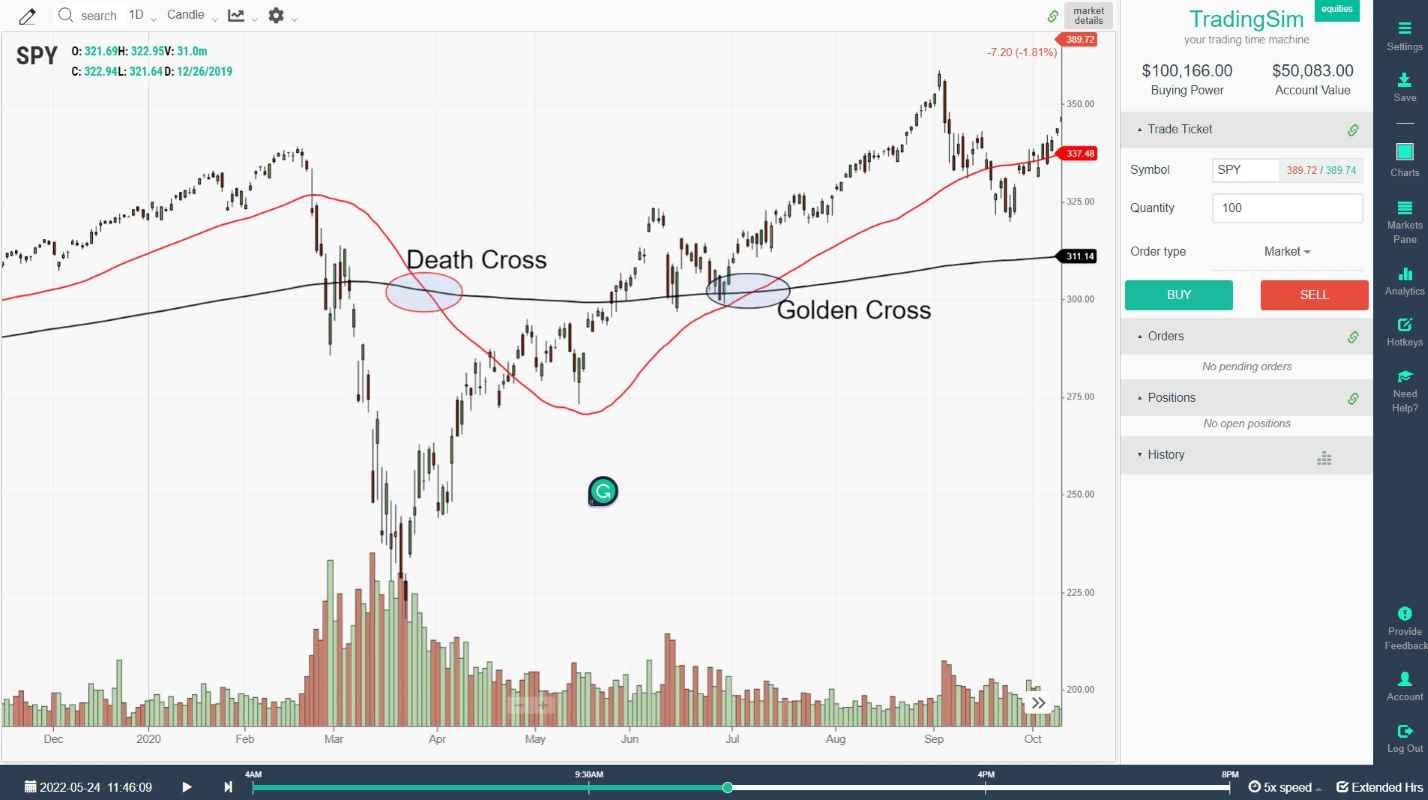
The death cross in stocks occurs when the 50 moving average (50ma) crosses below the 200 simple moving average. The 50ma is an intermediate-term moving average that is mostly used on a daily chart to determine if the trend is up or down. Likewise, the 200ma is used as a longer-term indicator to smooth out the price action and determine if the trend is up or down.
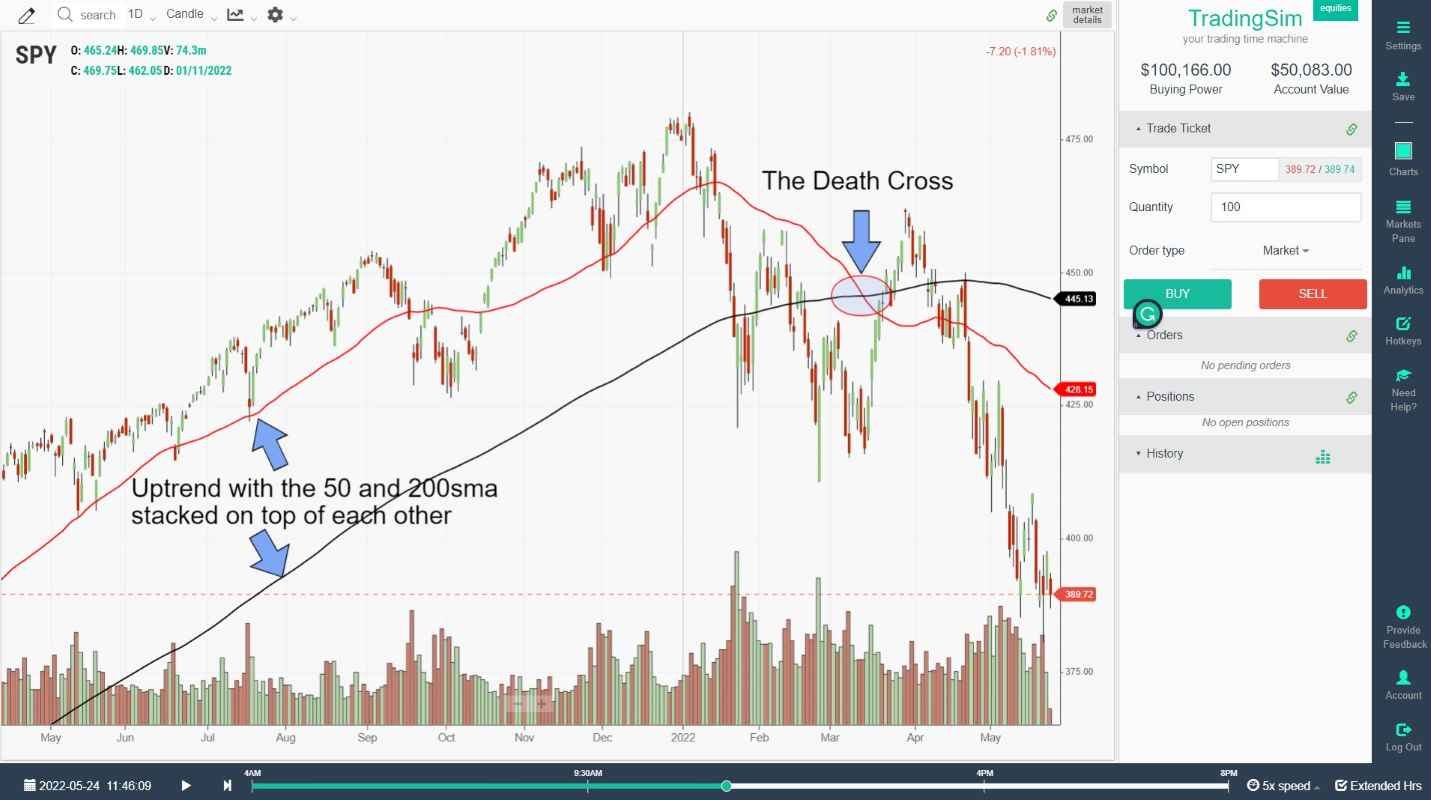
When these two moving averages cross, it can alert traders to an impending change of trend. In this fashion, when a trend has been upward for many days, you'll see the 50ma and the 200ma both trending upward, one below the other. However, if the market is beginning a new phase of distribution, you'll see these two moving averages begin to level out and potentially reverse course.
When this reversal happens, the intermediate trend eventually overtakes the longer-term trend and the new direction is downward. When that cross occurs, we call it a death cross, signifying the demise of the prior uptrend or bull market. This is often an indication that foretells a bear market.
The Death Cross vs. the Golden Cross
As the names imply, one of these patterns represents a bullish event while the other represents a bearish event. The death cross occurs when the 50sma crosses the 200sma on a daily chart to the downside, implying lower prices in the stock market. The Golden Cross occurs when the 50sma crosses upward through the 200sma implying higher prices in the stock market.
Granted, when either of these events happen, the market is usually going sideways or only beginning a new trend. Therefore, the price action can be very tricky around these events. However, the general idea is to allow these moving averages to smooth out the price action for the longer-term trend trader.
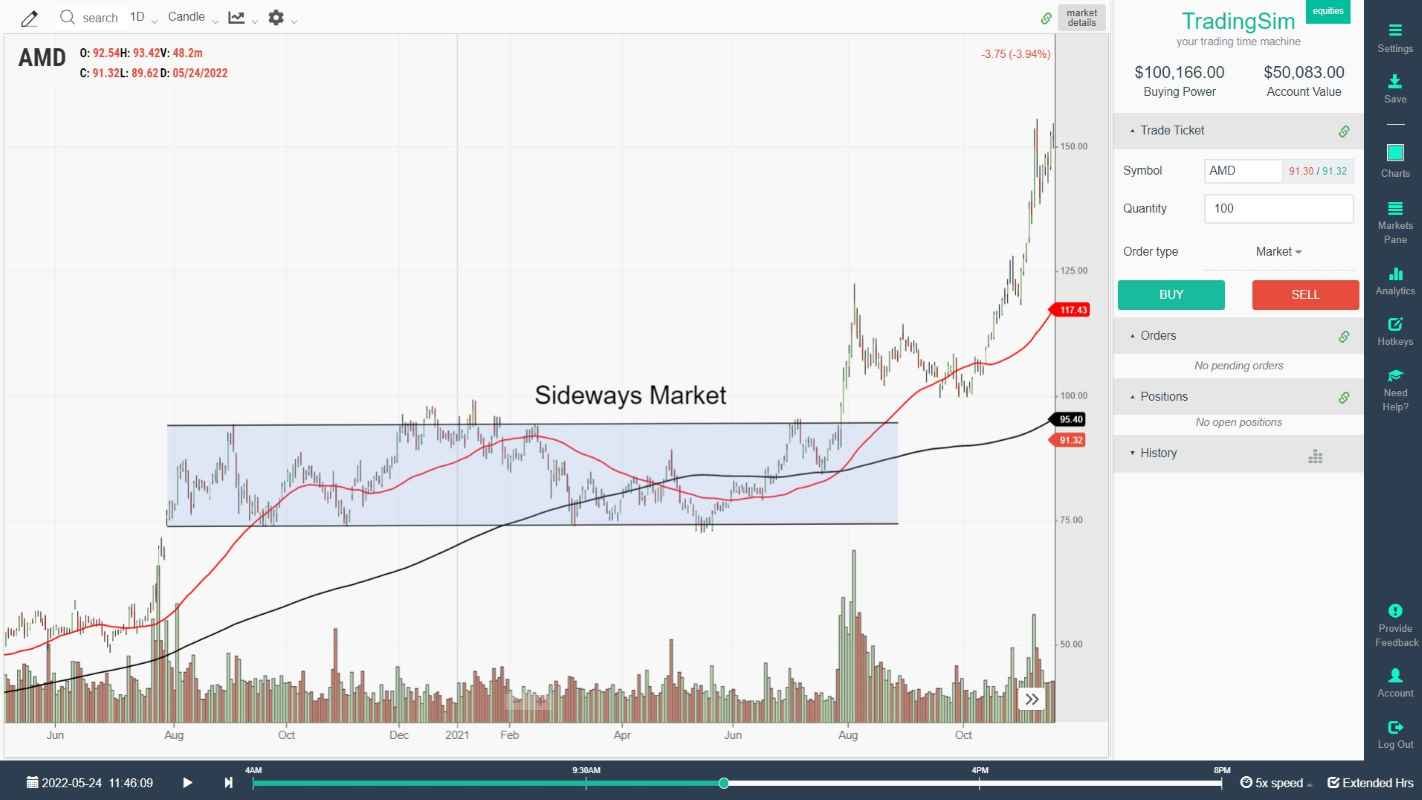
We've seen a death cross in the example above, here is a visual of the golden cross in the SPY daily chart:
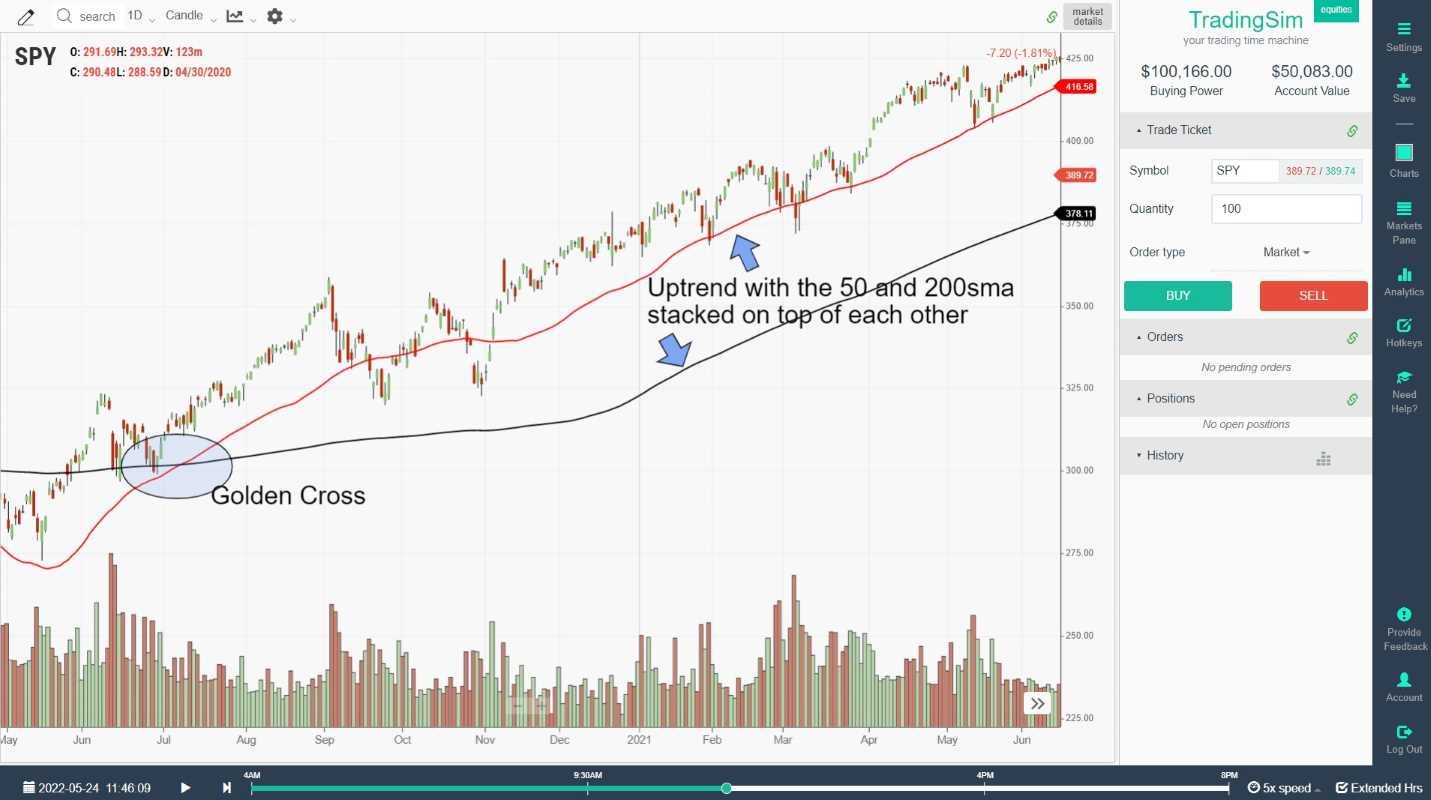
As you can see, this Golden Cross example led to a long and sustained uptrend. This is what many trend traders use these moving averages and patterns for. Many investors will simply set their black boxes to buy and sell on these signals alone.
What happens after a death cross?
What happens after a death cross in trading is not always predictable. Many times a death cross will signal lower prices in a stock. However, some death crosses may simply reverse in short order. We call these consolidations.
Generally speaking, for a death cross to create a sustained downtrend the market in which the death cross occurred must enter a recession or long-term bear market. For example, after the crash of 2008 and the financial crisis, the S&P 500 entered a bear market along with an economic recession.
Death Cross Chart Examples
In this chart example of an S&P 500 death cross, the death cross pattern occurred in late 2007, but the market didn't produce a golden cross pattern until later 2009, after almost two years of down-trending markets.
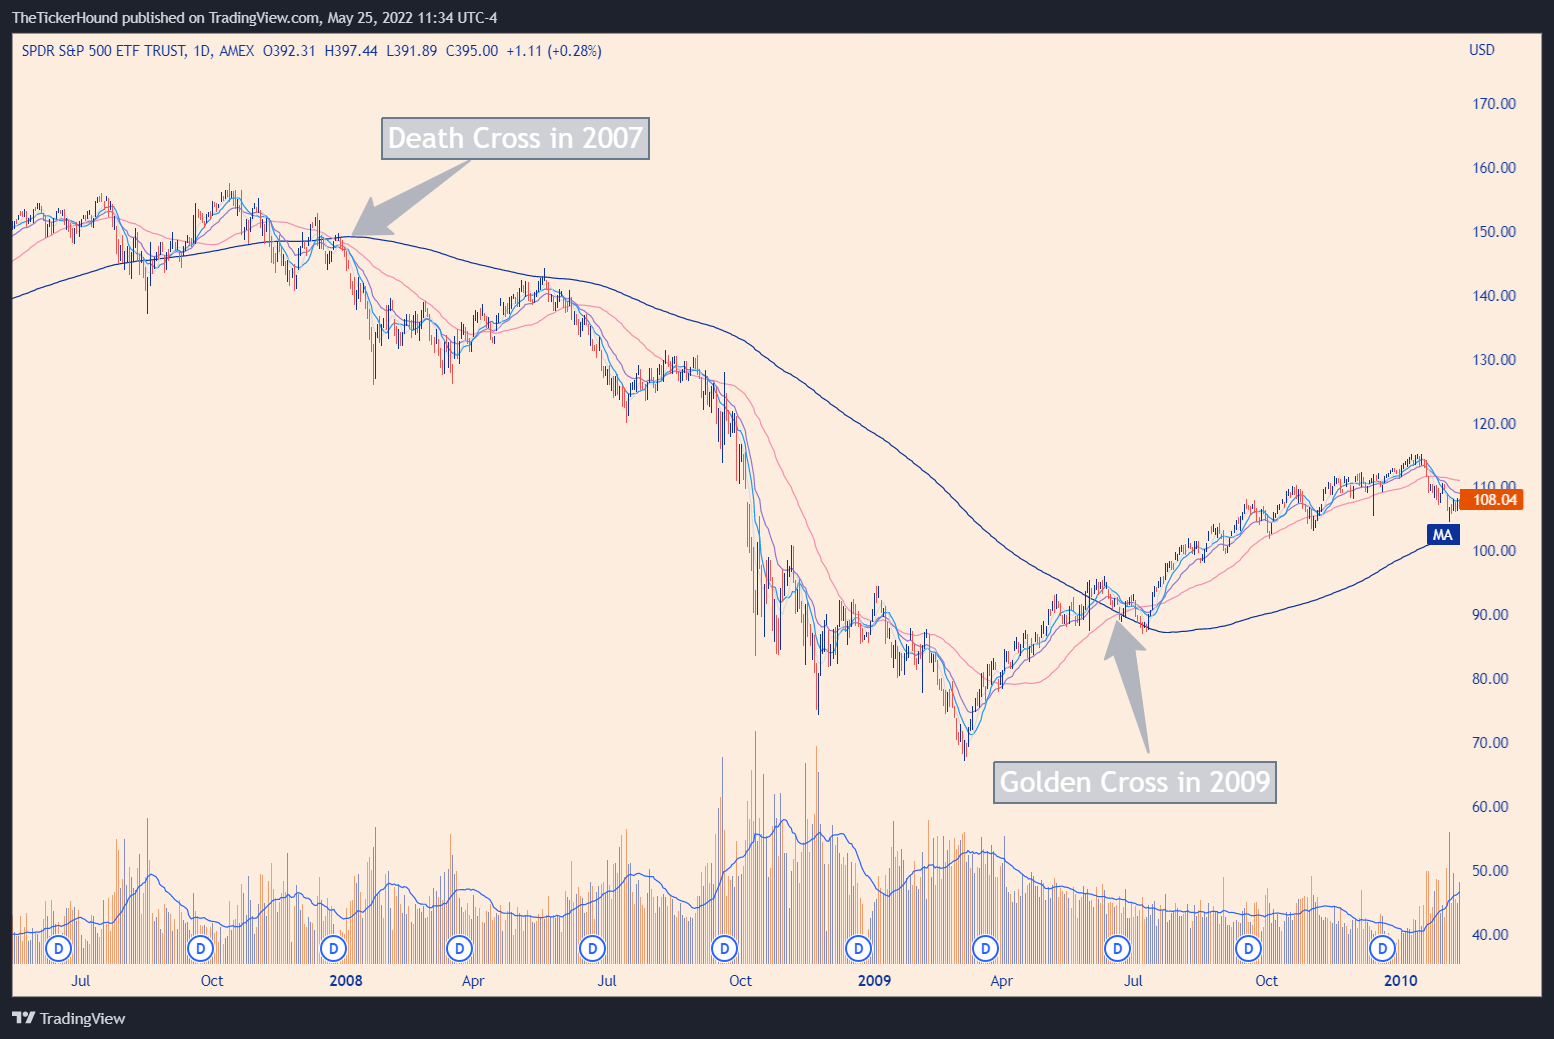
In comparison to other market downturns, the 2008 crash was much broader and lasted much longer. For example, we've had many market corrections that have produced a death cross pattern in trading, but none of them lasted very long. Here is a death cross from 2018:
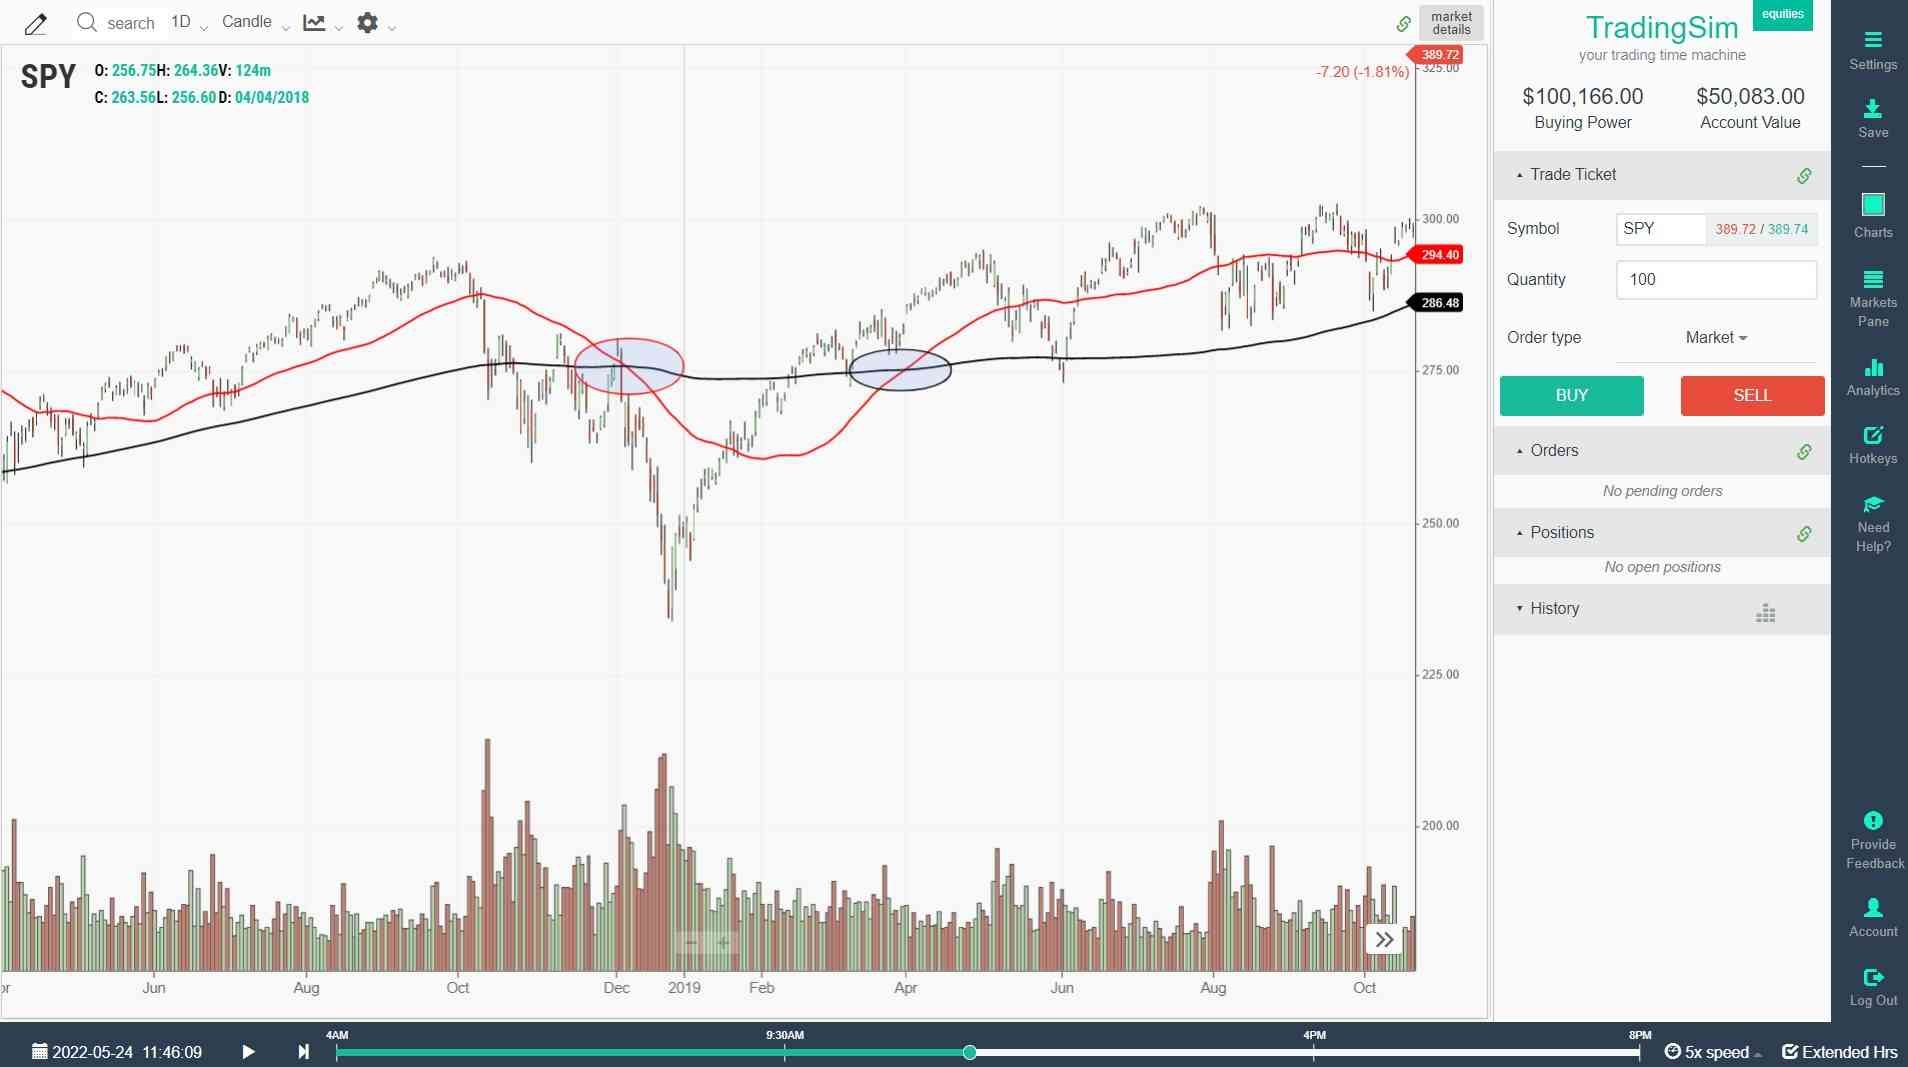
Notice how the correction was sharp, but the recovery was also just as sharp. This led to a golden cross just a few months after the initial death cross pattern. In another example, the Covid Crash of 2020 appeared dramatic and violent to the stock market. However, it was short-lived. While it produced a death cross, it also recovered quickly in comparison to 2008.
As you can see, what happens after a death cross is highly subjective to the market, the speed of the selloff, and many other factors. In fact, you can see by looking at some of these charts that by the time the death cross occurs, the market has already reached a bottom.
Could it be that market makers wanted to trigger long-term algorithmic selling only to rally the markets? Hmmm... We'll leave that one for the conspiracy theorists to debate.

Is a death cross bearish or bullish?
A death cross is generally considered bearish for stocks as it indicates a longer-term moving average cross in a bearish direction. However, this can be misconstrued as many times a stock will simply consolidate for many months and years. This allows the longer-term 200sma to catch up with the 50sma, but not necessarily in a bearish fashion.
Sideways and choppy markets can produce death crosses and golden crosses. For that reason, we like to see more rapid rises or declines in price action to validate a death cross or golden cross. It may be better to see a nice head and shoulders pattern forming with the death cross pattern to really confirm a longer-term bearish move.
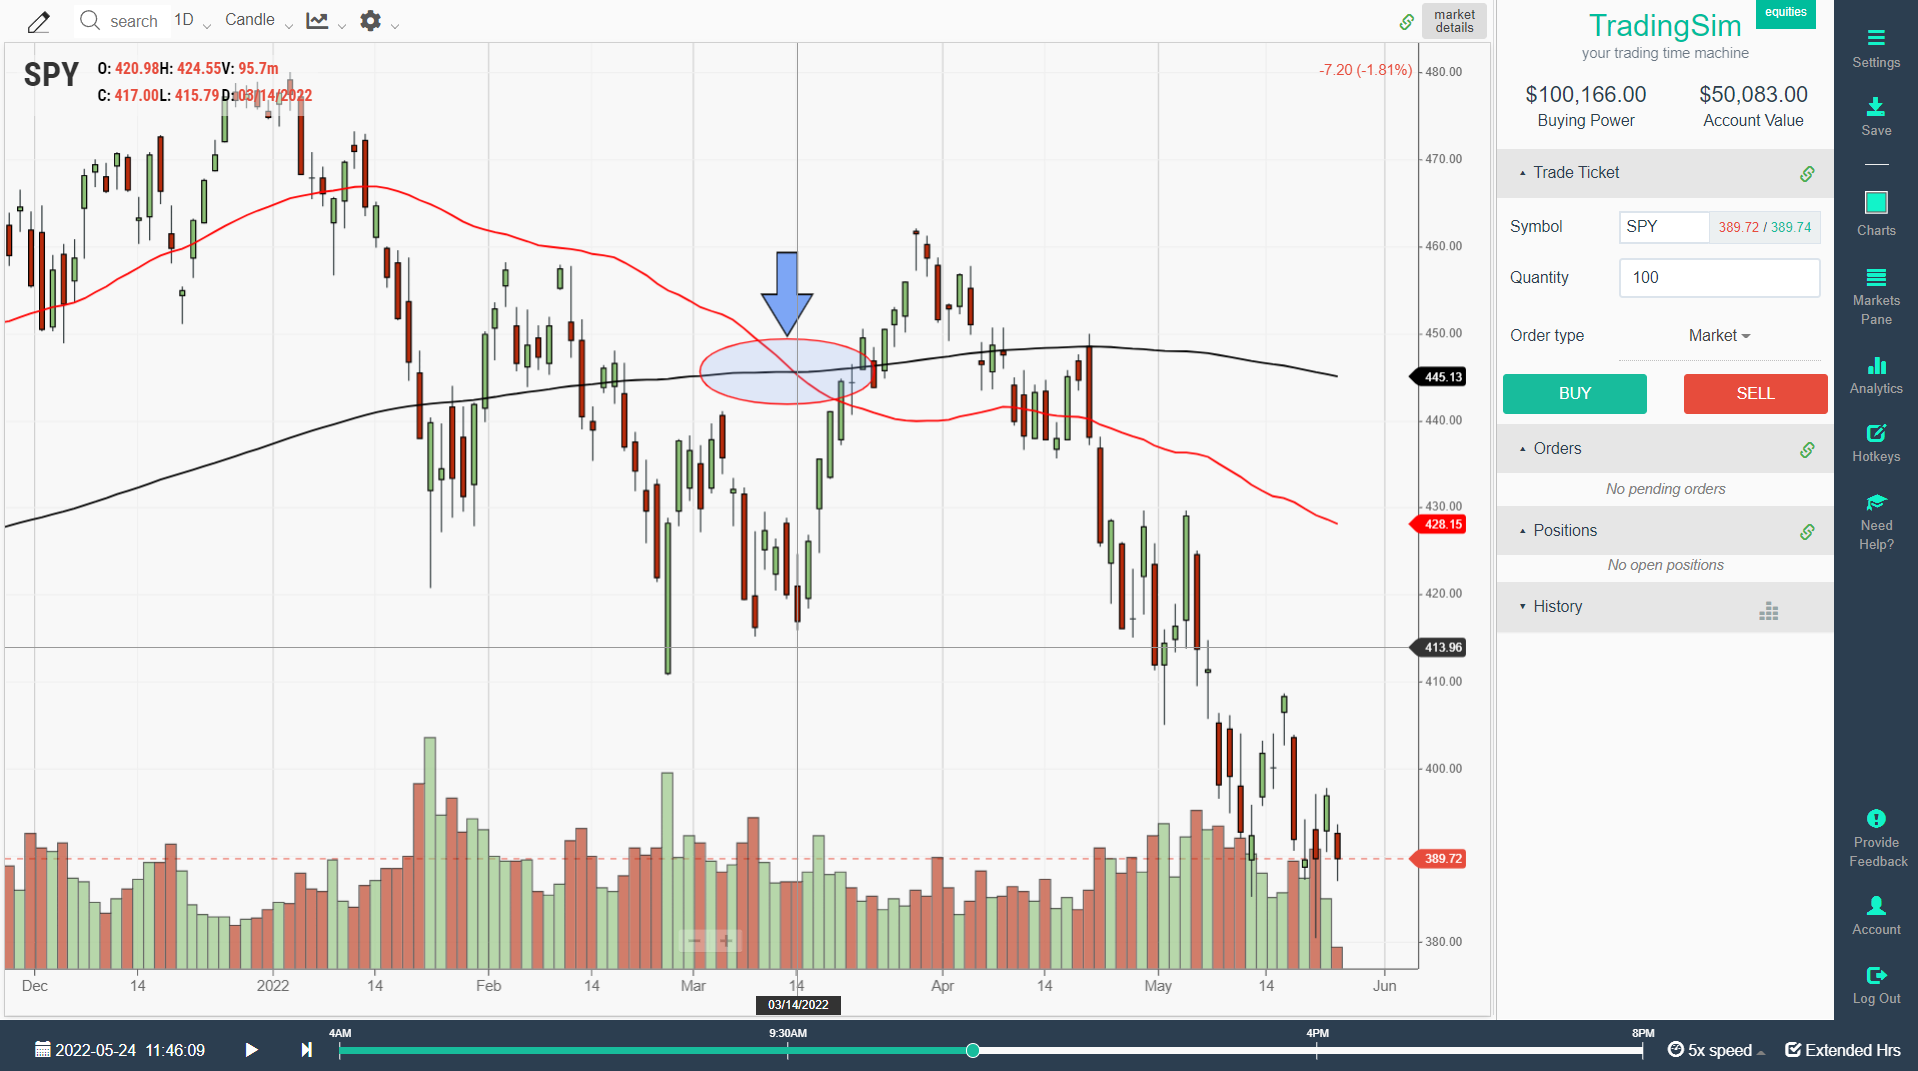
When was the last death cross?
As of May 2022, the last death cross that occurred in the stock market indices was the 14th of March. Around this time, the SPY was selling off hard from its recent highs. However, the market had reached near-term oversold conditions and rallied hard shortly after this death cross occurred.
Individual stocks, futures, or commodities can also experience a death cross pattern. It is just a matter of time after a nice bull run and a good pullback that these will occur. All you have to do is put a 50sma and a 200sma on your daily charts in order to see when these crosses occur.
What is a bitcoin death cross?
A bitcoin death cross is no different than a death cross in any other asset class. It occurs when the 50sma crosses below the 200sma on a daily chart. This crossover pattern is an indication that intermediate-term Bitcoin prices are falling below longer-term support levels. Generally speaking, this is an indication that Bitcoin is in a corrective price phase.
What does a death cross mean for bitcoin (BTC)?
Not all death crosses are created equally. Many times a death cross can actually signal a bottom in crypto, stocks, or other assets. If the price action confirms this, often you will see bullish activity shortly after a death cross in Bitcoin.
However, if the death cross if formed after a slow and steady head and shoulders or double top, it could be the start of a new downtrend. Usually, the further Bitcoin goes up, the harder it falls. The best way to determine this is by studying the historical performance of bitcoin and when it has produced a death cross pattern.
Bitcoin Death Cross Chart Example
The two most recent bitcoin death crosses occurred in July 2021 and January of 2022. In the first death cross in this image, Bitcoin rallied soon after, producing a golden cross.
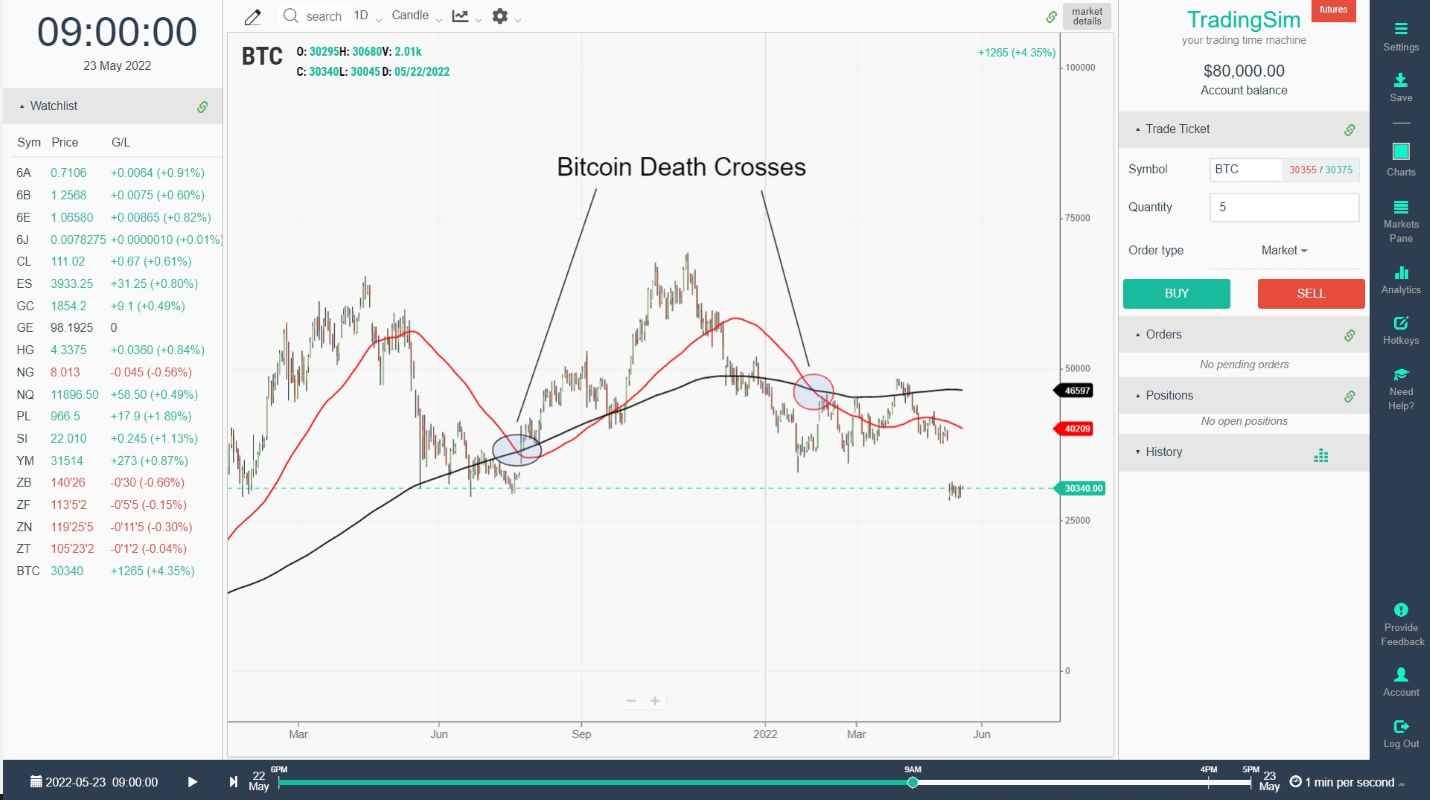
Given the example above, it is clear that not every BTC death cross is a bearish occurrence. It is always best to take into consideration the context of the price and volume. As yourself these questions as you consider whether a death cross is bullish or bearish:
- Is the crypto or stock in an extremely oversold condition and due for a bounce?
- Is the selloff slow and steady?
- Is there distribution or accumulation occurring during the correction?
How do you trade the death cross?
In order to trade the death cross pattern, you need a sound trading strategy with multiple confirming chart patterns. That is if you are a more active trader as opposed to a longer-term trend follower. If you are the latter, then the death cross actually becomes a sell-signal in and of itself (the buy signal being the golden cross).
However, to actively trade around the death cross as an event, you should study how your stock, crypto, or other asset has performed shortly after a death cross. For example, you may find that the more oversold an asset is when the death cross happens, the more chance you have of a reversal rally. If this is the case, look for bullish candlestick patterns and oversold conditions to confirm your long strategy.
On the other hand, if the market is slowly rolling over, you might look for healthy pullbacks into moving averages as shorting opportunities after the death cross is confirmed. This allows you to take advantage of a weak market by shorting weak rally attempts.
If you have already, be sure to read our post on how to find the backside of a trade. This may help with your shorting strategies and how you trade the death cross.
Conclusion: The death cross pattern
Remember that the death cross only occurs when the 50sma crosses below the 200sma. This doesn't necessarily mean that stock or crypto are completely bearish, despite being interpreted that way.
As always, we recommend that before you trade any pattern or strategy you spend time in the simulator looking and observing these patterns. Find out how they work, where you can manage your risk, and what criteria you can develop around an edge.


 Chart Patterns


