Rising and Falling Wedge Patterns: How to Trade Them [Updated May 2026]
May 16, 2026
Written by: Al Hill
✓ Reviewed by Kunal Vakil, Co-Founder of TradingSim · Updated May 16, 2026
Rising and falling wedges are a technical chart pattern used to predict trend continuations and trend reversals. In many cases, when the market is trending, a wedge pattern will develop on the chart. This wedge could be either a rising wedge pattern or falling wedge pattern. The can either appear as a bullish wedge or bearish wedge depending on the context. Thus, a wedge on the chart could have continuation or reversal characteristics depending on the trend direction and wedge type.
TL;DR — Rising & Falling Wedge Patterns
A falling wedge is a bullish reversal/continuation pattern where price compresses between two down-sloping trendlines that converge. A rising wedge is its bearish mirror — price compresses between two up-sloping converging trendlines. Both resolve with a breakout in the opposite direction of the wedge's slope, confirmed by a 1.5× volume expansion.
Falling wedge: bullish — breaks UPWARD ~68% of the time when volume confirms.
Rising wedge: bearish — breaks DOWNWARD ~63% of the time.
Required structure: at least 3 touches on each trendline; trendlines must converge (not parallel).
Volume: volume contracts inside the wedge and expands by 1.5×+ on the breakout candle.
Target: measured move from the widest part of the wedge, projected from the breakout point.
In this post, we’ll uncover a few of the simplest ways to spot these patterns. Likewise, will give you the best way to predict the breakout and trade them.
What do rising wedge and falling wedge patterns look like?
Although many newbie traders confuse wedges with triangles, rising and falling wedge patterns are easily distinguishable from other chart patterns. They are also known as a descending wedge pattern and ascending wedge pattern.
Rising Wedge – Ascending Wedge
The rising wedge pattern develops when price records higher tops and even higher bottoms. Therefore, the wedge is like an ascending corridor where the walls are narrowing until the lines finally connect at an apex.
The below image illustrates the rising wedge pattern formation:
Rising Wedge Pattern aka Ascending Wedge
Note that the rising wedge pattern formation only signifies the potential for a bearish move. Depending on the previous market direction, this “bearish wedge” could be either a trend continuation or a reversal. In other words, during an ascending wedge pattern, price is likely to break through the figure’s lower level.
A Bearish Wedge Pattern
Ideally, you’ll want to see volume entering the market at the highs of the ascending bearish wedge. This is a good indication that supply is entering as the stock makes new highs. A good way to read this price action is to ask yourself if the effort to make new highs matches the result.
Along those lines, if you see the stock struggling on elevated volume, it could be a good indication of distribution.
Falling Wedge – Descending Wedge
A falling wedge pattern is an exact mirror image of the rising wedge. As a descending wedge pattern, it develops on the chart when there are lower bottoms and even lower tops:
Falling Wedge aka Descending Wedge
As you can see, the bottoms are decreasing, but the tops are decreasing at a faster pace.
Opposite to rising wedge patterns, falling wedge patterns are typically a bullish wedge, which implies the price is likely to break through the upper line of the formation. Much like our discussion above on ascending wedges, this descending wedge pattern should display the inverse characteristics of volume and price action.
Bullish Wedge Pattern
As a bullish descending wedge pattern, you should notice that volume is increasing as the stock puts in new lows. As this “effort” to push the stock downward increases along the lows, you’ll notice that the result of the price action is diminishing. This is likely due to accumulation efforts.
For this reason, it is commonly known as a bullish wedge if the reaction is to the upside as a breakout, aka a falling wedge breakout.
Predicting the breakout direction of the rising wedge and falling wedge patterns
Let’s be clear once again: rising and falling wedge patterns could result in a continuation or reversal. It all depends on the direction of the primary trend, and the context of the volume and price action.
You may be thinking, “But how is it possible for a pattern to have two very different outcomes?”
The answer to this question lies within the events leading up to the formation of the wedge.
Wedge Stock Pattern – Trend Continuation
During a trend continuation, the wedge pattern plays the role of a correction on the chart. For example, imagine you have a bullish trend and suddenly a falling wedge pattern develops on the chart. In this case, the descending wedge represents a correction. Thus, we expect a price breakout from the wedge to the upside.
The same applies for rising wedge patterns. The difference is that rising wedge patterns should appear in the context of a bearish trend in order to signal a trend continuation. Ultimately, the price action will break to the downside.
Wedge Chart Pattern Trend Continuation Example
Take a quick look at the image below, which shows how ascending and descending wedges behave during a bullish market:
Rising and falling wedge continuation patterns
As you can see from this 10-minute chart of GM, it is in a strong uptrend, which is tested a total of 9-times 9 (the blue line).
There are two falling and two rising wedge patterns on the chart.
As previously stated, during an uptrend, falling wedge patterns can indicate a potential increase, while rising wedge patterns can signal a potential decrease. Notice that the two falling wedge patterns on the image develop after a price increase and they play the role of trend correction.
Conversely, the two ascending wedge patterns develop after a price increase as well. For this reason, they represent the exhaustion of the previous bullish move. After the two increases, the tops of the two rising wedge patterns look like a trend slowdown. Hence, they are bearish wedge patterns in the short-term context.
Conversely, during a downtrend, we have the exact same scenario – price is likely to increase after a falling wedge pattern and price is likely to decrease after a rising wedge pattern. However, since the equity is moving downwards, our rising wedge pattern implies trend continuation and the falling wedge pattern – trend reversal. This is when the two types of wedges switch their roles. Yet, their behavior and potential remains the same.
Here is an example for your consideration:
Rising wedges in a downtrend
Trend Reversal
In different cases, wedge patterns play the role of a trend reversal pattern. In order to identify a trend reversal, you will want to look for trends that are experiencing a slowdown in the primary trend. This slowdown can often terminate with the development of a wedge pattern.
Remember our discussion earlier? The best way to think about this is by imagining effort versus result. Before a trend changes, the effort to push the stock any higher or lower becomes thwarted. Thus, you have a series of higher highs in an ascending wedge, but those highs are waning.
In other words, effort may be increasing, but the result is diminishing. This is typical of a reversal pattern.
Trend Reversal Chart Example
Wedge Trend Reversal Pattern
Above is a daily chart of Google and a 10-minute chart of Facebook showing the exact trigger for entering a position.
Note in these cases, the falling and the rising wedge patterns have a reversal characteristic. This is because in both cases the formations are in the direction of the trend, representing moves on their last leg.
How to trade ascending and descending wedge patterns?
Every wedge strategy has a signal line. Depending on the wedge type, the signal line is either the upper or the lower line of the pattern.
For example, if you have a rising wedge, the signal line is the lower level, which connects the bottoms of the wedge. If you have a falling wedge, the signal line is the upper level, which connects the formation’s tops.
The wedge strategy is simply this: When you see a break in the signal line, you should enter the market in the direction of the break.
For example, when you have an ascending wedge, the signal line is the lower level of the figure. When you see the price of the equity breaking the wedge’s lower level, you should go short. At the same time, when you get a descending wedge, you should enter the market whenever the price breaks the upper level of the formation.
Wedge Strategy – Where should you place your stop loss?
When trading a wedge, stop loss orders should be placed right above a rising wedge, or below a falling wedge. You do not want to make your stops too tightly as the price action will often violate one of the trend lines before rebounding swiftly. Instead, you’ll want to see a real break of significance to know you need to exit your position.
Wedge Strategy – When should you take profits?
The potential price target of a wedge is equal to its size.
This means that if we have a rising wedge, we expect the market to drop an amount equal to the formation’s size. If we have a falling wedge, the equity is expected to increase with the size of the formation.
Below you will see an image showing how to trade a rising and a falling wedge:
Wedge Strategy Trading Example
This is the 5-minute chart of JP Morgan. There are two wedges on the chart – a red ascending wedge and a blue descending wedge. We enter these wedges with a short and a long position respectively.
The overall JPM movement is bullish and the two wedges show a price cycle during a bullish trend:
Price bounces from a trend
Price starts hesitating and closes a rising wedge
The wedge is broken and the price decreases into a falling wedge
Price touches the trend and the falling wedge is broken in a bullish direction
New bullish movement appears
The blue arrows next to the wedges show the size of each edge and the potential of each position. The green areas on the chart show the move we catch with our positions. The red areas show the amount we are willing to cover with our stop loss order.
In both cases, we enter the market after the wedges break through their respective trend lines.
These two positions would have generated a total profit of 80 cents per share by JPM.
How to practice rising and falling wedge patterns
The best place to practice any strategy is in a market simulator. We suggest flipping through as many charts of the more liquid names in the market. Get out your trend line tools and see how many rising and falling wedges you can spot. Draw them, and then make note of the price action on the breakout or breakdown, identifying what made them a bearish wedge or a bullish wedge.
While you do this, analyze the bigger picture context. For example, is the stock in an uptrend or downtrend? What do higher time frames like the 15m, 1hour, or daily chart look like? Also, what does volume look like during the pattern?
Many times, you may find that volume recedes during bearish continuation wedges, while it may increase in bearish reversal wedges.
Over time, you should develop a large subset of simulated trades to know your probabilities and criteria for success before you put real money to work.
We hope this helps, and here’s a quick summary in parting:
Falling Wedge vs Rising Wedge: The Key Differences
Both patterns share the same structural skeleton — two converging trendlines — but the slope tells you everything about the expected resolution.
Falling wedge: both trendlines slope downward, with the upper line falling faster than the lower line. Compression to the downside, breakout to the upside. Bullish.
Rising wedge: both trendlines slope upward, with the lower line rising faster than the upper line. Compression to the upside, breakout to the downside. Bearish.
The mistake new traders make: confusing a falling wedge with a descending channel (parallel lines, not converging) or a rising wedge with an ascending channel. Wedges must converge. If the lines stay parallel, it is a channel and the breakout statistics are different.
Step 1: Confirm the structure. You need at least 3 touches on the upper trendline and 3 touches on the lower trendline. The lines must converge. Volume should be visibly declining as the wedge tightens.
Step 2: Wait for the breakout candle. Price closes above the upper trendline on volume at least 1.5× the 20-day average. Use RVOL for a real-time read. The breakout candle's range should also expand — not a doji or small-body breakout.
Step 3: Enter on the breakout close or first pullback. Aggressive traders enter on the breakout close. Conservative traders wait for a retest of the broken trendline as new support. The retest entry has a better fill price but a lower probability of triggering (only ~40% of breakouts retest).
Stop and Target
Stop: just below the most recent swing low inside the wedge, or below the breakout candle's low — whichever is tighter while still avoiding obvious noise.
Target: measure the widest part of the wedge (the distance between the upper and lower trendlines at the start of the pattern), then project that distance upward from the breakout point. Conservative traders take partial profits at 50% of the measured move and trail the rest.
How to Trade a Rising Wedge (Bearish Breakout)
The rules are the mirror of the falling wedge. Wait for a close below the lower trendline on expanding volume, enter short on the breakout or the first pullback, stop above the most recent swing high inside the wedge, and target a measured move equal to the widest part of the wedge projected downward.
Rising wedges in uptrends are tougher to trade. When the broader market is making new highs, individual stock rising wedges can break out higher instead of breaking down. Always check the prevailing trend on the SPY/QQQ before shorting a rising wedge in a strong tape.
Wedge Pattern Failure Modes (What Kills Most Trades)
Wedge patterns have a real edge, but specific failure modes cost most traders money. Know them in advance.
Failure 1: The False Breakout
Price breaks through the trendline, triggers entries, then closes back inside the wedge. The remedy: require a closing break, not an intraday wick. A wick through the trendline that closes back inside means nothing.
Failure 2: The Premature Entry
Traders front-run the breakout by entering when price approaches the trendline. They get filled, then watch price bounce off the trendline and head back to the other side. The wedge is a setup; the breakout is the trigger. Wait for the trigger.
Failure 3: The Wedge in the Wrong Market Regime
Falling wedges in strong bear markets often break downward (continuation), not upward. Rising wedges in strong bull markets often break upward (continuation), not downward. The "reversal" interpretation assumes the wedge forms at the end of a trend. In the middle of a trend, the wedge is more often a continuation pattern.
Failure 4: The Low-Volume Breakout
A wedge that breaks out on volume below the average has a high failure rate — sometimes above 70%. The breakout needs participation. Without volume, you're watching algorithmic noise, not a real change in supply/demand.
Wedge Patterns vs Flags, Pennants, and Triangles
Wedges are part of a larger family of compression patterns. Knowing the differences helps you size the trade and set realistic targets:
Flag/pennant: short consolidation (5–15 bars) after a sharp move; trendlines are parallel (flag) or converge slightly (pennant). Continuation pattern with measured-move targets equal to the flagpole length.
Symmetrical triangle: converging trendlines like a wedge, but both lines slope toward each other at roughly equal angles. Directionally neutral — breakout direction unknown until it happens.
Ascending/descending triangle: one flat trendline + one sloping trendline. Directionally biased toward the flat line break.
Wedge: both trendlines slope in the same direction at different angles. Directionally biased against the slope.
Test pattern recognition in a futures trading simulator or replay-based platform before trading live — the patterns look obvious in retrospect and ambiguous in real time.
Frequently Asked Questions
What is a falling wedge pattern?
A falling wedge is a bullish chart pattern where price compresses between two down-sloping trendlines that converge over time. The upper trendline falls faster than the lower trendline. It typically resolves with an upward breakout, especially when volume expands on the breakout candle.
Is a rising wedge bullish or bearish?
A rising wedge is bearish. Despite price making higher highs and higher lows inside the pattern, the converging trendlines signal that momentum is weakening. The pattern usually resolves with a downward breakout, with the breakout direction confirmed by volume expansion.
How reliable is the falling wedge pattern?
Falling wedges break upward approximately 68% of the time when confirmed with volume expansion on the breakout candle. Without volume confirmation, the win rate drops below 50%. The pattern is more reliable in trending markets than in choppy, range-bound conditions.
What is the target after a wedge breakout?
The standard target is a measured move: take the widest part of the wedge (vertical distance between the two trendlines at the start of the pattern) and project that distance from the breakout point in the breakout direction. Conservative traders take partial profits at 50% of the measured move.
How do you tell a wedge from a triangle?
The key difference is trendline slope. In a wedge, both trendlines slope in the same direction (both up or both down) at different angles. In a triangle, the trendlines slope toward each other — symmetrical triangles have both lines converging, ascending triangles have a flat top, descending triangles have a flat bottom.
Related Trading Resources
Continue your trading education with these related guides from TradingSim:
Alton Hill is the Co-Founder of TradingSim with over 18 years of trading experience. He completed the Design Thinking Bootcamp at Stanford’s D.School and brings expertise in Product Development to create the best trading simulation experience. His strategy focuses on trend-following systems, targeting high-volatility stocks with strong primary trends using the 15-minute chart.
The Descending Triangle Pattern - Learn 5 Simple Trading Strategies [Updated April 2026]
The descending triangle pattern is a type of chart pattern often used by technicians in price action trading. The pattern usually forms at the end of a downtrend or after a correction to the...
3 Simple Cup and Handle Trading Strategies [Updated May 2026]
What Is a Cup and Handle Pattern? A cup and handle pattern is one of the most reliable technical chart patterns in trading. It’s formed when a stock pulls back gradually (creating a U-shaped cup),...
Parabolic SAR – Formula and Trading Examples with Multiple Timeframes
In this article, I will discuss several key things related to the Parabolic SAR indicator. The topics will range from how to compute the indicator, all the way to how to interpret buy and sell...


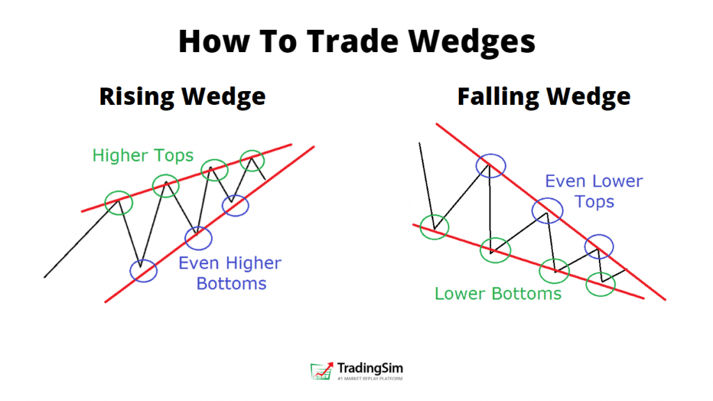
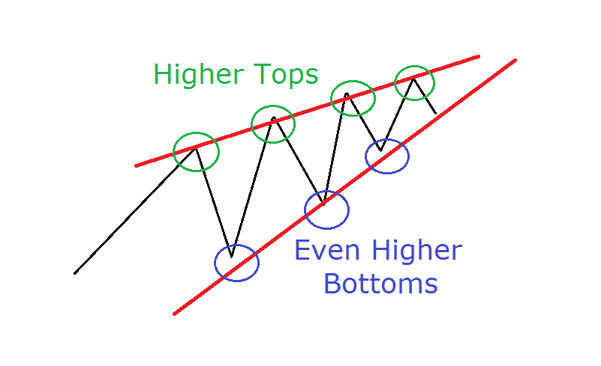
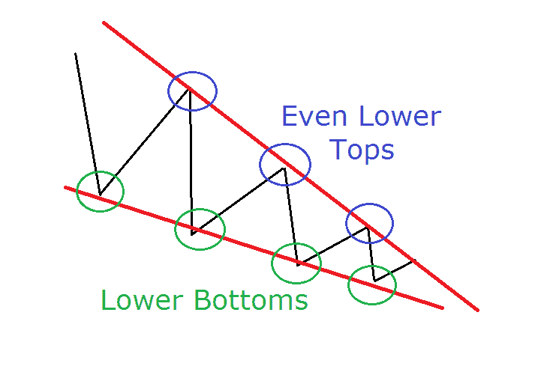
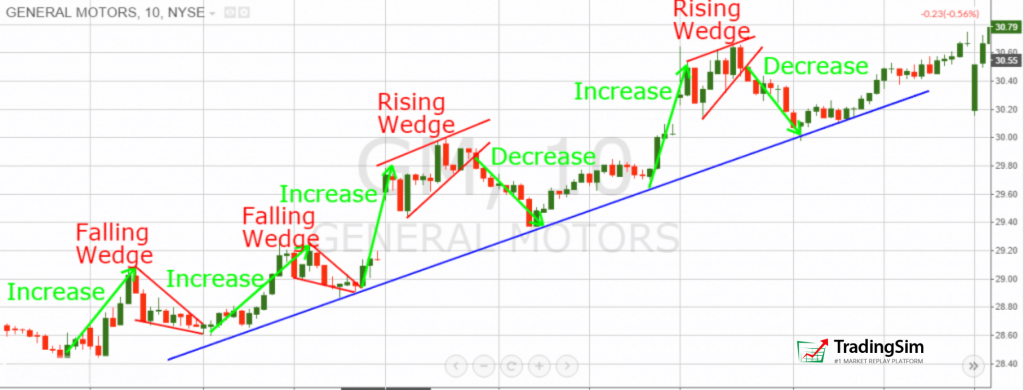
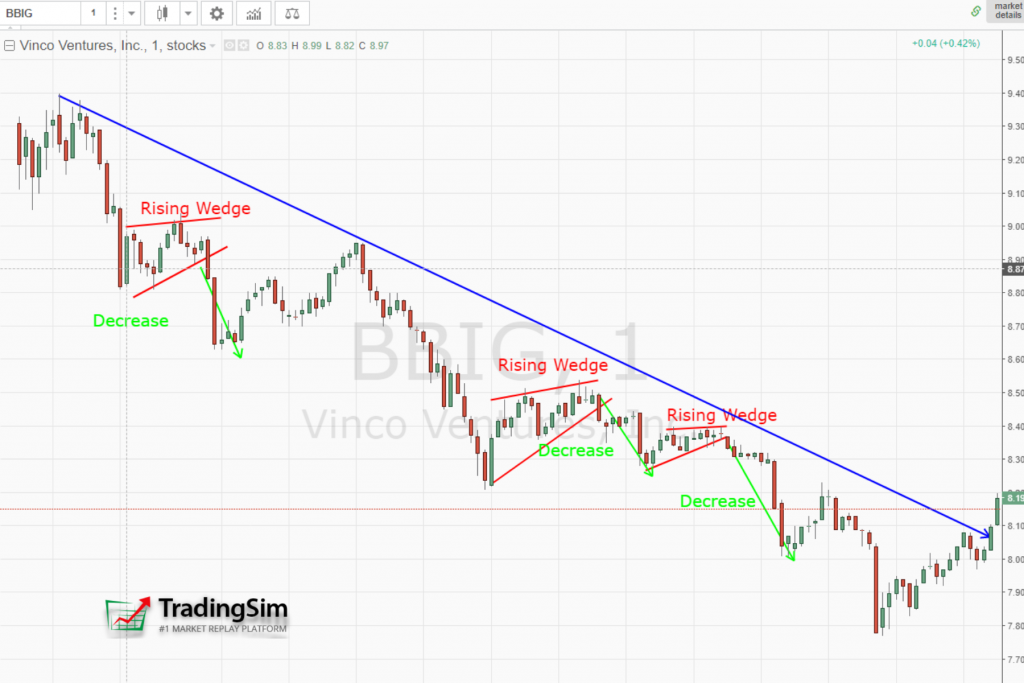
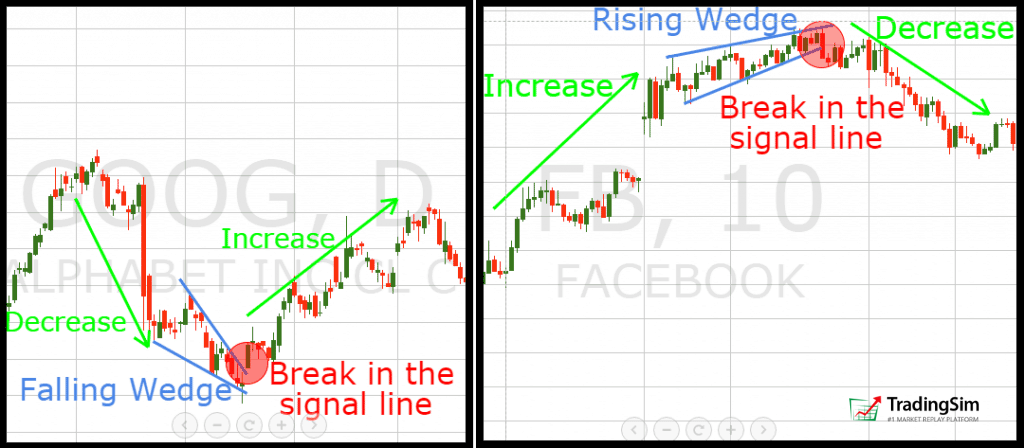
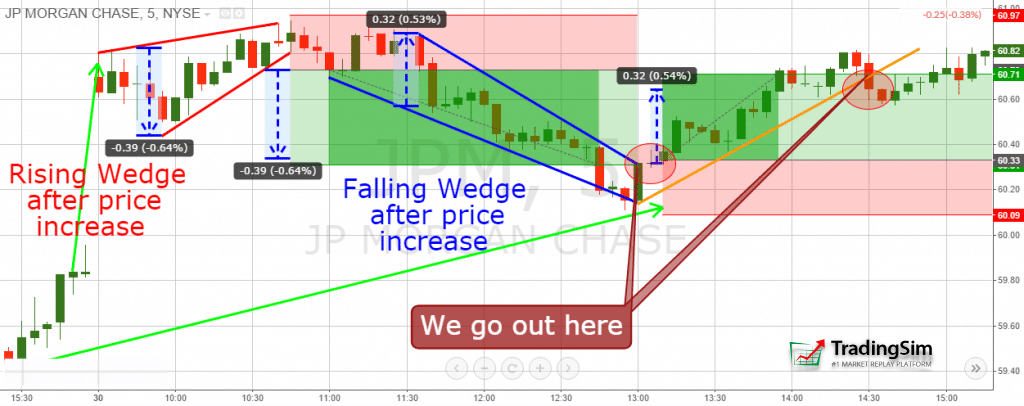


 Chart Patterns


