I have written a few articles on trend reversal patterns, but I would like to dive into the topic of buying and selling climaxes when day trading. The obvious question you probably have is if someone is buying a lot of shares and I am long, this is a good thing right? Well, it is when the buying is healthy in nature. However, if the buying and selling are extreme, this is a sign the retail or uninformed trader has entered the market and there is no one left to sustain the current move.
So, why should you care about buying or selling climaxes? The short answer is you can make money trading this basic formation and you can save money by not ending up on the wrong side of the market. If timed just right, going in the opposite direction of a climactic move can yield sharp returns. In this article we will cover real-life examples of buying and selling climaxes.
Big Money Players
In the market you have the small percentage of traders who make the vast sum of profits. Then there is the retail or uninformed investors who fund the top 1% of traders’ lifestyles. The buying and selling climax setup is the greatest example of this redistribution of wealth you will find in the market. Normally the big market players will accumulate and/or distribute their shares overtime in a healthy manner. This is because the large players understand if they were to try and offload and/or accumulate large positions in one transaction; it would disturb the natural law of supply and demand.
Retail Investor
Climaxes are nothing more than traps for the average trader. Buying and selling climaxes are one of the toughest patterns to experience as a uniformed trader. Reason being they generally occur around the time of a major news event. For example, a company will announce record earnings and everything from the quarterly reports looks great. Naturally you place an order to buy the stock and for a short time things are working in your favor. Then just when you begin to get comfortable in your position, the stock will have a sharp reversal and drop like a rock. This is a demoralizing experience because not only were you wrong in your trading approach, you were dead wrong!
How to Trade Buying and Selling Climaxes
Below are the rules for how to trade buying and selling climaxes:
Identify volume increases >300% of the last 5 trading days. This first rule assumes you are day trading (intra-day charts).
Look for a test or break of the demand/supply line (top or bottom of the trend channel).
Place your buy order .25% above or below the candlestick (depending on if you are going long or short).
Place your stop below or above the high of the opening candlestick (depending on if you are going long or short).
The stock can never break the low of the first candlestick if going long and cannot exceed the high of the first candlestick if going short.
Close your position at the supply line or a back test of the trend channel
Selling Climax Example
Our first example comes from Facebook (FB) on the morning of January 31st, 2013. As you can see from the below 15-minute chart Facebook had a clear uptrend that began in the middle of December and ran through January.
On January 31st Facebook gapped down 7% through the channel and the volume was significantly higher. You will also notice how the long-tail candlestick developed on the 5-minute chart. At this point in the trade requirements 1 and 2 have been met for trading the selling climax.
The first candlestick has a high of $29.36 and a low of $28.74. To satisfy rules 3 and 4 we would place our buy order at $29.43 and our sell order at $28.73. The price target would be the previous demand line (bottom line) of the trend channel at ~$31.50. Based on our stop order and profit target the trade provides us a 3-to-1 risk reward ratio.
After entering the trade you will see how Facebook rallied to close the gap in a b-line fashion.
Without these rules in place of how to view a morning gap on high volume you would have done one or more of the following:
Sold Facebook short after it gapped down
Closed your long position prior to back testing the demand line
Failed to book profits after Facebook clearly back tested it’s demand line twice
Not placed an initial stop order when you first opened the position
Are you starting to see how the smart money makes money now?
Buying Climax Example
Looking at Facebook, if we go back to October 24th, 2013 there is a clear example of a buying climax. Facebook had been in a flat trading range for three months, beginning in mid-July.
Notice the spike in volume that shot Facebook right up to its supply line. Facebook quickly stalled after the first candlestick. The high of the candlestick was $24.25 with a low of $23.68. This means our stop would be at $24.26 with a short entry at $23.62. The potential profit target for this position is $19 which is the bottom of the trading rage. This represents a risk of .62 cents with a profit target of $4.62. I don’t know about you but I would take a 7.45 risk-to-reward ratio any day of the week.
Let’s fast forward to see how this trade would have played out.
Facebook in fact pulled back to the demand line (support), at which you would have exited the trade with a handsome profit.
From this article I hope you have picked up on the following:
Even though you may be day trading, you should still have some context of the bigger trends to determine if your stock is hitting larger supply or demand lines
Some day traders avoid opening positions after the first candlestick (myself included) but given the right circumstances it can be profitable
Learning how climax events work, you should avoid the scenario where you enter a trade only to have it fade – immediately resulting in a losing position
Clear profit targets of when to exit your position. Far too often newbie traders will hold onto a position and miss out on booking profits.
Learn how to identify and day trade a bull trap | Tradingsim Video Lessons
I saw a great trade example that I had to share with you guys; we are going to walk through how to day trade a bull trap. As many of you know, Valeant Pharmaceuticals (VRX) has had a downward death...
Learn How to Day Trade a Stock with a News Catalyst [Video]
Do you want to learn how to day trade a stock with a news catalyst. In this example, we are covering a buyout or takeover rumor on HOG: Harley Davidson. On Friday, July 1, it was rumored that KKR was...
What is Day Trading? The act of buying and selling securities intra-day with the expectation of making fast profits within minutes to hours is known as day trading. Day traders come in all shapes and...

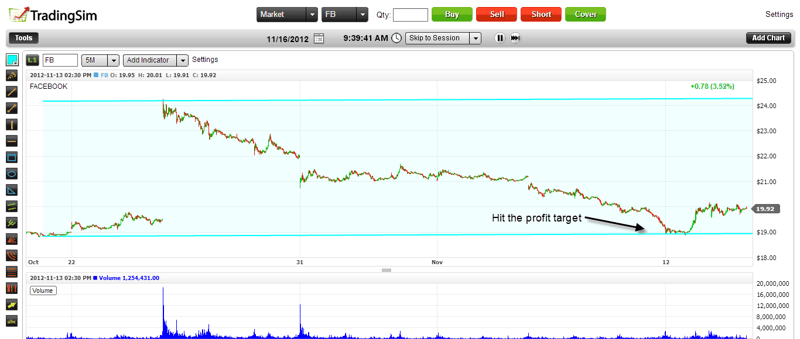


 Chart Patterns


