10-Day Moving Average Overview
The 10-day moving average is one of those indicators that everyone knows about. From the new trader to the 30-year seasoned veteran.
What makes it so popular?
The quick answer is that it’s simple to understand and it does an awesome job tracking price movement.
In this article, I will discuss the 10-day moving average and how it applies to trading. The article will have a heavy focus on day trading, but these principles can be applied to any timeframe.
How to Calculate the 10-Day Moving Average
The 10-day moving average is something straight out of elementary school, again which is what makes it so great.
The average is based on the closing price of a security over the last 10 periods. You can check out this online moving average calculator here if you would like to perform the calculations yourself. [1]
10-period simple moving average formula
Day 1 Closing Price – 100
Day 2 Closing Price – 102
Day 3 Closing Price – 99
Day 4 Closing Price – 104
Day 5 Closing Price – 103
Day 6 Closing Price – 107
Day 7 Closing Price – 105
Day 8 Closing Price – 110
Day 9 Closing Price – 111
Day 10 Closing Price – 112
Once you add up all of these closing prices and divide them by 10, you get $105.3o. Well now that you feel comfortable with the math, let’s complicate things a little.
Different Types of 10-Day Moving Averages
The technical analysis world wouldn’t exist if there weren’t people trying to make things more complicated. The 10-day moving average is not immune to this problem.
These additional 10-day moving averages go beyond the scope of this post, so I’m not going to do deep dives, but I want to make you are aware of their existence.
10-Day Exponential Moving Average
The exponential moving average uses the SMA as the base of the calculation and then applies a smoothing factor. The EMA is for traders that want to reduce the lag of the simple moving average. [2]
10-Day Weighted Moving Average
The weighted moving average applies more weight to the most recent price action within the formula. It’s similar to the exponential, except it’s not a smoothing factor. Therefore, you can configure the indicator in terms of which periods you weight the most.
For example, if you want to create more of a lag, you could even place more weight on historical periods and not the most recent.
[Video] How to Add the 10-Period Simple Moving Average to Your Chart
Below is a quick video of how to add a 10-day simple moving average to your chart.
When is the Best Time to Use the 10-Day Moving Average?
The 10-day moving average is a trend following indicator. This means the indicator is not going to tell you where the price is headed but rather gives you a visual of how strong a security is trending.
To this point, it’s best to use the 10-period moving average to gauge the health of a stock on the move.
Morning Trades
in the morning stocks will trend and trend hard. This is where the 10-period SMA comes in handy. This is because the 10-day moving average keeps you close to the action. If you were to use a 20 or 50-day moving average, it would give the stock too much room to go against you.
The morning is a funny time in the market. Stocks pretty much move in the same patterns.
If a stock is breaking out or down, they will run from the open into the 10:30 am timeframe and at times until 11:30 or so but then something happens.
The volume starts to dry up and the ranges of the periods begin to decrease. This pausing of the action can take shape in the form of sideways action for the remainder of the day or the stock may make a move to test its highs between 1 pm and 2 pm.
Nevertheless, the strong moves are likely done for the day.
10-Period SMA Chart Example
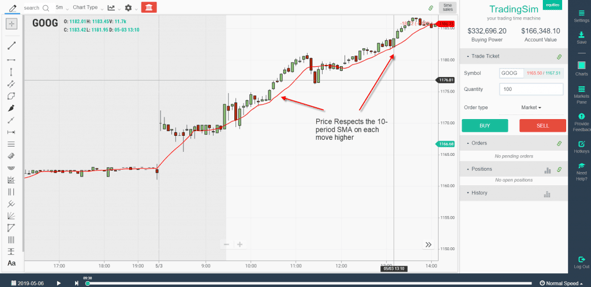
This pattern above of Google is what plays out in the market every day.
As a day trader or active trader, the 10-day moving average trails the price action closely. This ensures that if you are a momentum trader, you are only staying in a position if it is moving in your desired direction.
Once you see the moving average broken to the downside, you can close the position or at a minimum lighten up your size.
Short Example
The moving average works the same on short trades as well.
Short Example
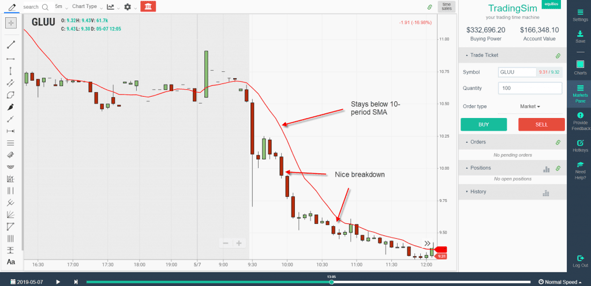
It is literally the same setup, just the inverse.
In this example, GLUU which is a pretty volatile stock had a nice breakdown in the morning. The stock stayed below the 10-period SMA all the way down into that 11:30 am time zone before basing out.
When can the 10-day Moving Average Fail You?
Late Entries on Breakouts
The 10-day moving average is a lagging indicator. This means the indicator will not do you any good in forecasting a major price move. By the time the average catches up to the price, you would have already missed the move.
To this point, you will need to use other technical indicators to determine when to enter a trade such as price action.
So, if you are waiting for a signal from a moving average before entering a morning breakout or breakdown, you will be behind the eight ball.
Sideways Markets
Sideways markets are a slow bleed for trend following systems. The reason is, sideways markets have no real trend. These setups come down to buying support and selling the high.
However, the moving averages within ranges are a mess. [3]
The price will cross the averages multiple times on its move up to resistance and back down to support.
Therefore, it’s not a great idea to even base exits on moving average crosses.
10-day moving average
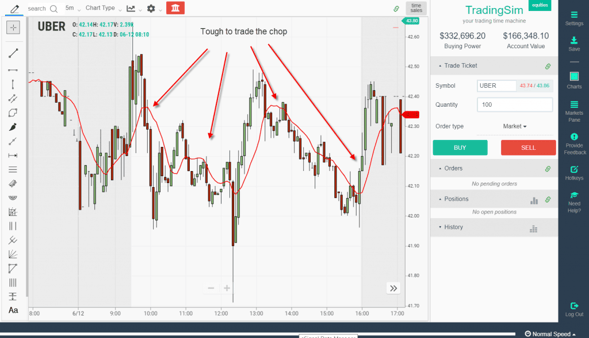
Above is a chart example of UBER. As you can see on this 5-minute chart, once in a trading range, the price action moves above and below the average with ease and does not give any clear direction of which way the price will ultimately break.
[Video] Comparison of Different Moving Average Periods
As mentioned earlier in this article, there are different types of averages. But there are also different periods.
A general rule of thumb is that you want to use a shorter time period (1o or less) to gauge short-term moves. That’s why, thus far in this article, we have discussed morning trades and momentum setups since we are using the 10-period SMA.
However, if you are looking to trade intermediate trends you will want to use the 20 or even 50-period moving average.
Lastly, if you are looking at long-term trends you will want to bump it up to 100 or even 200 periods.
In the next video, we are going to discuss the differences between the 10-period SMA and 100-period SMA when looking at Netflix. This is a morning breakdown trade.
If you are interested in trading with the 10-day moving average, try using the indicator within Tradingsim. We have a market replay platform that allows you to trade real data from the past two years, tick-by-tick.
You can then see if the indicator is a good fit for you and your trading style.
External References
- Simple Moving Average Calculator. wpcalc.com
- Some Techniques Used in Technical Analysis. The University of Notre Dame. p. 2
- Trading with Moving Averages. RJO Futures


 Awesome Day Trading Strategies


